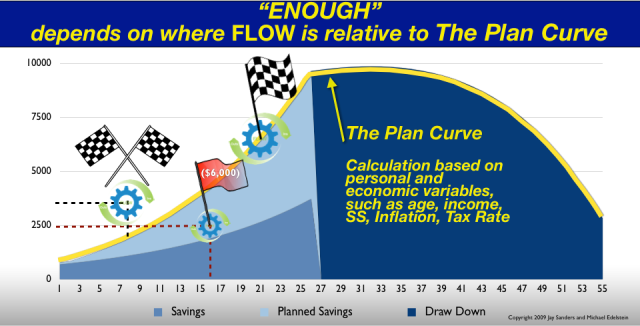
In “Getting to know The Curve and Flow” I introduced the duo which is fundamental to having a true understanding of personal financial planning. This post is the first of a series on the elements required to construct the Plan Curve and the economic forces, macro and micro that impact it. The Plan Curve concerns itself with one’s goal for retirement. As such, it’s a graphic representation of the planned “target stats” required to reach that goal.
First a note of explanation. My sole purpose in describing the elements is not to impress and certainly not to bore. Rather it is to plant the tiniest tiny seed of consciousness and knowledge about planning for your personal financial future. Hopefully it grows and develops the emotional wings which lead to action.
Successful personal financial planning requires the discipline of an iterative systematic process where tracking and reporting plays the major role. The Curve and Flow were developed to support that process with an easy to understand visual tool.
Elements of the Plan Curve (E1….E8)
In order to identify the mathematical elements of the Plan Curve let’s use the example of Bob and Nancy, both 40 years old , whose goal is to retire, financially independent, 25 (E1) years later at age 65. Their current income is $75,000 (E2) and they expect inflation to be 3% (E3) on average between now and retirement. They believe that they’ll be able to live comfortably during a 30 year (E4) retirement on the purchasing power equivalent of their current income (E5). Currently they have $150,000 (E6) in their company 401K plans and no other savings (E7) available for their retirement goal. They expect the social security system will be unable to meet its commitment to Americans between now and retirement and accordingly believe their benefits at retirement will be 1/2 of the current expectation (E8).
I’m going to end this post here even though we have more elements to consider. I’ll pick them up in my next post. The take away from the above is that there’s lots of moving parts in the Plan Curve. All of them are subject to change not the least of which is that 25 years is a long time. So if you’ve made it this far you’re probably saying why bother?
Why because you’re stating a goal and establishing a plan. It’s the beginning of a systematic, self-correcting process and if you stick to the process your odds of reaching your goal will be greatly improved. Check out my post on “Target Stats” for more.
Want more? Subscribe to my blog. If you know someone who would like this, share it with them.


